Public-use priority — 11 September 2026. The immediate deliverable is a practical community scenario tool: documented flare cases, consistent place comparisons, matching-period air-quality benchmarks and a short explanation of potential health relevance. Additional internal wind-model tracing and temperature-precision investigations are optional research, not prerequisites for publishing that tool. Current release/heat records, representative local weather and suitable transport, pollutant-specific chemistry and background remain the most useful improvements for quantitative local exposure claims. The existing map remains illustrative; its physics have not been relabelled as a forecast.
11 September 2026 · Living research plan
Goal: produce traceable estimates of flare-related outdoor concentrations for all communities in the modelled Howe Sound–Squamish area, with demonstrated performance for the weather and operating conditions being assessed. Every input should identify its source, date, quality, units and remaining uncertainty. The present explorer is still an educational model; its more fluid map presentation does not change that status.
The first milestone is to reconstruct observed valley winds during dated events. Once that works, use verified engineering release cases for conditional concentration predictions. A reconstruction of an actual flare event additionally needs simultaneous flare, weather and air-monitor records. A forecast needs separate testing of forecast weather errors. These are different products, and we will label them accordingly.
The vertical-wind discrepancy now has a traced mechanism. Captured, unchanged-output replays show that terrain-tangent redirection creates much of the selected large vertical increment, with smoothing partly cancelling it. Independent checks cover the original area, time/height distributions and reference profiles. Stage attribution and data.
Temperature preparation and convective history are now separated. Two unchanged replays reproduce the actual gradient calculation exactly. The complete common-height comparison supports 38,935 of 244,824 original-area cell-hours; none of the 13 reference points has all required near-ground brackets. Preparation/sampling and the convective override dominate this descriptive comparison. Separately, unrounded temperature, pressure and humidity were recovered for a preselected 100-column native tile. The tile printing-sensitivity check is now complete and independently reproduced; it does not resolve the wind-performance or near-ground coverage limits. Further internal thermal work is parked while the public-use release is completed. Higher precision does not fill the near-ground support gap. Thermal calculation and figure, higher-precision archive, earlier vertical-stability comparison.
Three historical cases are now selectable. The Explorer adds the 14-hour LPCF tank-shutdown reconstruction, full-day time controls and explicit scheduled-versus-emitted mass. A source comparison shows rates and event totals for PM₂.₅, NOx, CO and total VOC. The calculation still uses illustrative fixed weather and prescribed injection height. Scenario inputs, timing and checks.
Vertical refinement does not resolve the transport discrepancy. Nine matched 10-, 18- and 34-layer cases retain the original study area and all 13 references. The largest preselected vertical excursion persists around −11 m/s, while the airport comparison is unchanged. A separate comparison with native model W uses identical support across all nine cases; it is a model comparison, not observation validation. Refinement results, native comparison and limits.
The marine thermal path is now identified. The current wind-only configuration takes the neutral overwater fallback. Populated native skin temperature and heat-flux fields are not presently used through that path. A prognostic thermal sensitivity would change donor selection, low-level temperature and surface exchange together; it requires explicit assumptions and captured diagnostics before interpretation. Source trace and next experiment.
Saved winds can now be explored across the study area. A new interactive wind study shows all 24 hourly intervals and three settings from the expanded 1 June 2023 calculations, with a common wind-speed scale and consistent reference-point sampling. It presents actual saved diagnostic winds, separately from the illustrative plume. Display data and methods.
The low-level processing trace narrows the airport mismatch. Using the same four native points and interpolation weights, mean airport speed is 4.06 m/s before profile processing, 4.02 m/s after that processing and 4.01 m/s in the final adjustments-off field, against 1.71 m/s observed. Most of this day's station speed mismatch is already present in the regional forcing. All original study cells and 13 reference points were compared; no location was tuned. Trace and independent reproduction.
Native water and thermal fields are now checked across the forcing grid. All 20 archive tiles link to the retained 2,000 native cells and 25 states. Water code 16 includes 39 lake-marked cells; the airport-nearest native point is among them. All 50,000 SST values are zero upstream, while simulated skin temperature and surface heat flux are populated. These fields have not been substituted into the model. Native-surface evidence and data.
Coordinate conversion does not explain away the vertical excursions. Two explicit collocation methods reconstruct model-implied physical vertical velocity from saved terrain-following W. The persistent terrain-case excursion remains about −11 m/s under either method. Their differences are retained across every interior cell, not just the extreme. Physical validation remains necessary. Vertical-coordinate reconstruction.
A dated engineering plan now improves the flare-location evidence. The District-linked overall plot plan, revision 6 issued for construction on 16 August 2024, depicts the HP/LP flare. A scale-qualified read-off places its base approximately at E482010/N5501780 in UTM Zone 10 NAD83(CSRS), about 490 m from the existing map proxy under an explicitly approximate datum comparison. This is a dated location candidate, not surveyed current tip geometry. Its 205 m radiation-evaluation annotation is not an established stack height. The next record target is the current source schedule and accepted Flaring Management Report linked to this drawing and any successor. Drawing evidence and exact source.
Calculated winds now checked against airport observations. For the complete 1 June 2023 model day, all six CALMET cases overestimate mean airport speed: 4.01–4.28 m/s against 1.71 m/s observed. Added surrounding terrain changes that station result only slightly. An independent reconstruction reproduces all 168 pairs, seven summaries and 42 direction/cohort rows. Source inspection establishes the interval-end wind alignment; the subsequent low-level trace quantifies the fixed extrapolation assumption’s modest effect for this day. One station/day and unresolved upstream assimilation do not establish airshed validation. Full-day comparison and data.
Large vertical components persist in the expanded domain. The separate source-and-equation audit checks 28,512,720 interior values within the existing arithmetic tolerance. The large original terrain-following W excursion remains well inside the enlarged boundary. Equation consistency and added terrain alone do not establish physically realistic vertical transport. Vertical-wind findings and methods.
Expanded-domain winds now compared across the whole study area. Three additional full-day CALMET runs add 10 km of terrain on each side of the original grid. The comparison covers all original cells and all ten existing place references under common criteria. Every original inner terrain and surface input reproduces exactly; 87,266,160 new wind values passed structural and finite-value checks. The largest near-surface domain change is 4.79 m/s, while area-wide averages are much smaller. Radius sensitivity remains after the expansion; neither setting is validated by this test. A new community-coverage audit identifies reserve polygons missed by regular grid centres. Full-area findings and maps, community coverage. Earlier five-run results remain available in the first study and wind-driver diagnostic.
We have now compared an actual ECCC HRDPS forecast initialized 2 September 2026 at 00:00 UTC, hours 1–24, with 48 matched observations at Squamish Airport and Pam Rocks. For the eligible hours, mean wind-direction error was 30.8° at the airport and 104.6° at Pam Rocks. The forecast missed much of Pam Rocks’ observed direction change. This is a single forecast episode, not seasonal validation, an inversion diagnosis or a flare reconstruction. Dated comparison, source files and limitations
The nearest native forecast point to the Woodfibre map proxy is 1.15 km west and has 568 m model terrain, compared with approximately 9 m in the legacy shoreline elevation check. Two sampled pressure levels are below that model ground and have been excluded as atmospheric samples. This is a concrete obstacle to treating a coarse forecast as source-site wind. Better-looking interpolation cannot establish the missing valley and shoreline flow.
The earlier observed May case independently shows spatial variation: at 06:00 PST on 2 May 2025, Pam Rocks reported 9.4 m/s while the airport reported calm. All data remain labelled by observation versus forecast, clock convention and measurement interval. Pollutant hour-ending averages have explicit UTC start/end fields; they are not silently treated as instantaneous weather observations. Observed-case findings
The immediate weather research priority is now specific: obtain source-site observations and vertical profiles, determine a terrain-appropriate treatment of the shoreline, and test whether it reproduces observed reversals across independent episodes. Preserve this poor-performance case when evaluating any proposed improvement.
Later public-record checks found a July District project update and an August federal health-assessment reply, but no current Woodfibre flare source table or accepted Flaring Management Report. July/August monthly correspondence bundles were not listed, so their contents cannot be described as fully reviewed. Search coverage and exact gaps. Two concise existing-record request drafts are ready for review; none has been sent.
A full-year observed comparison now supplies 8,730 simultaneous 2025 airport/Pam Rocks wind pairs. In 914 pairs the airport reported calm while Pam Rocks reported at least 5 m/s. Twelve observation-selected seasonal test episodes are preserved, with missing hours, flags and clock checks. Matching archived HRRR weather has now been acquired for six forecast hours within two of those episodes, not the full episodes or all twelve cases. Annual wind benchmark and episode inventory
The first archived winter and summer HRRR tests provide 24 matched station-hours. During the winter window, Pam Rocks observations remained northerly while the forecast temporarily reversed. Its six-hour wind-vector error was 10.12 m/s, despite model surface elevation at that station being close to the observed elevation. Summer errors were smaller in the selected window; this cannot establish seasonal skill or rank models tested on different dates. The nearest Woodfibre point is 1.13 km away at 38 m model elevation, with steep terrain contrasts in neighbouring cells. A closer elevation alone does not validate source-site wind. Findings, figure and exact provenance, original forecast source pack
The next round of work has added June 2026 onsite daily pollution and weather tables, a matched 1 km versus 2.5 km forecast test, and a reproduced complete AERMAP → AERMET → AERMOD official reference chain. Daily onsite values retain Level 0 air-quality status, missing entries and unconfirmed clock conventions. They cannot replace hourly wind direction or vertical profiles. Onsite data and access routes, full model-chain verification
The finer forecast places the nearest Woodfibre grid point 170 m away at 135 m model elevation, improving the former 1.15 km / 568 m representation but retaining a substantial shoreline mismatch. In the same six observed hours, its wind-vector error was worse at the airport and slightly lower at Pam Rocks; both underestimated strong Pam Rocks winds. Local performance must therefore be tested before accepting the finer weather input. Matched forecast comparison
The public data trail now identifies an annual onsite meteorology technical data report and a distinct Squamish lidar study beginning in May 2016. The associated hourly records and raw profiles have not been recovered. These are concrete existing-data targets, alongside the 2010 radar/RASS archive. Inversion depth and wind direction remain unmeasured in the recovered daily tables. Exact sources, coverage and access limitations
A bounded follow-through of the 2024 and 2023 Federal Decision Statement reports found no hourly meteorology file or TDR in their appendices or embedded links. The March 2025 monitoring report provides a more specific existing-record identifier: Woodfibre LNG Export Facility Meteorology Technical Data Report – Draft, covering September 25, 2023–March 31, 2025. Seek that report and any later version covering the complete 2025 period, together with the underlying hourly files. A prepared operator inquiry remains unsent. March 2025 monitoring report, §2.1 and references
P0 means a prerequisite for a credible site calculation. P1 materially constrains transport or chemistry. P2 improves local detail or supports independent review. These are research priorities, not estimates of health risk.
| Priority | Information to obtain | How to find it and what to check |
|---|---|---|
| P0 — current source | Separate identities, surveyed coordinates, ground/tip elevations, dimensions and exit conditions for each flare; normal, commissioning, maintenance, upset and emergency cases | Start with BCER’s current facility permit, waste-discharge application and accepted supporting reports, then Woodfibre’s engineering submissions. Request the source table and drawings behind the reports. Distinguish maximum permitted, design, expected and measured values. |
| P0 — emissions and heat together | Time-resolved vent-gas flow, composition, heating value, pressure/temperature, assist gas, flame/pilot status, combustion basis and pollutant-specific rates | Locate the accepted Flaring Management Report and underlying calculations. Obtain profiles by event, with sampling interval and reference conditions. A monthly gas volume or annual pollutant total cannot determine an hourly exposure peak. Heat and emissions must describe the same physical case. |
| P0 — existing model files | Source inputs, meteorological files, terrain/receptors, model versions, configuration, flare-rise calculations and output | Search the EAO project library, BCER releases and Woodfibre filings before rebuilding an assessment. Seek the electronic run package; a PDF is not enough to reproduce it. Check whether the design and model predate later amendments. |
| P0 — local weather | Onsite and corridor wind, temperature, pressure, humidity, rainfall, radiation/cloud information, instrument heights and exposure, raw records and QA flags | Obtain the identified Woodfibre hourly files and TDR. For the acquired Tantalus and Eagle Ridge records, resolve stored timestamp/DST rules, direction convention, anemometer heights and QA. Compare like measurement intervals: road winds are preceding-hour vector averages, whereas the numerical weather fields are model states at their timestamps. Preserve the demonstrated forecast reversal and shoreline-terrain cases. A surface station does not measure elevated plume winds. |
| P0 — background and verification | Concurrent town and onsite PM2.5, NO/NO2/NOx, ozone and SO2; instrument methods, inlet heights, calibration and missing-data records | Assess the spatial suitability of the checked town-background candidates against the full 2025 paired-day comparison. Obtain final onsite hourly values, QA flags and the data/error/settings files referenced in the calibration forms; match them to the identified instrument serials and exact November changeover. Dated instrument evidence. Preserve native time conventions and detection limits. Select background by a documented method that accounts for wildfire, traffic, shipping and construction; do not add a single convenient reading everywhere. |
| P0 for inversion claims — vertical structure | Wind direction/speed and temperature with height; inversion base/top, depth of outflow, reversals and calm episodes | First establish whether the project, universities or public agencies already hold profiles. If not, design a coordinated wind-profiler and temperature-profile campaign after initial model evaluation identifies the missing regimes. Aerosol-layer height alone is not a temperature inversion measurement. A forecast profile alone cannot validate an inversion. |
| P1 — representative regional weather | Archived, three-dimensional numerical-weather fields for the same observed episodes and representative years | Evaluate the acquired B.C. WRF 4.6.0 / 1.333 km / 40-level candidate and retain its CALWRF processing history. Obtain the provider's configuration, evaluation report and FDDA station/time inventory; do not label assimilated stations as withheld validation. Resolve native terrain, vertical coordinates, temporal coverage and observation operators before comparing episodes. The January and June surface comparisons identify local performance problems; they do not validate source-site vertical flow. Obtain the actual archive configuration and station/time assimilation inventory, plus independently observed temperature and wind profiles. |
| P1 — chemistry and particles | Emitted NO2:NOx ratio, ozone, sulfur content, individual VOCs, primary/condensable particle fractions and particle-size information | Obtain feed-gas specifications, flare design/performance information and applicable testing methods. Use comparable-flare research to bound uncertainty only when fuel, tip, operating range and combustion conditions are relevant. Total VOC cannot become a benzene estimate; NOx cannot silently become NO2. |
| P0 before community risk comparisons — receptor coverage | Complete community and occupied-area coverage, including Nation communities, Britannia Beach and sensitive public locations; explicit receptor heights and terrain | Use the new public polygon audit to identify coverage gaps. Verify current Nation/cadastral, municipal and SLRD geography plus official facility directories. Add receptors within small relevant areas as well as a regular grid; evaluate plume and community extent beyond the display boundary. Apply the same pollutant, averaging, background and uncertainty criteria everywhere. |
| P2 — terrain and receptors | Source survey, current buildings, land cover, shoreline and receptor elevations/heights | Build on the checked Canadian CDEM coordinate/interpolation path; audit newer NRCan lidar/DEM coverage, dates and vertical datum, and verify current source-site geometry. Add public community receptors at justified heights. Finer receptor spacing does not make the weather field finer. Choose a larger modelling domain where needed while retaining the useful 20 × 20 km community view. |
| P2 — independent checks | A frozen run package, withheld observations, sensitivity results and qualified independent review | Agree performance checks before evaluating final maps. Publish successful and failed weather regimes. Test domain, grid, time-step, source and chemistry sensitivity. Call scenario ranges probabilities only when their weights have evidence. |
Detailed access routes, acquired files, limitations and acceptance checks are in the weather/data roadmap, source/emissions roadmap and modelling and validation roadmap.
Maintain one register with: input; required units/resolution; best available evidence; whether it is observed, verified engineering information, reconstructed or assumed; owner/source; what it affects; next acquisition step; and the test that would close the gap. Keep missing values missing. Record changes to defaults with their evidence rather than quietly substituting a plausible number.
Prefer recovering existing records to purchasing instruments. Where observations are absent, use a small set of physically consistent sensitivity cases, not independent extremes that could never occur together. Report which uncertainty dominates the community result. Collect new data where it can distinguish those cases.
For a possible field programme, the immediate questions are: which existing source–shoreline–town stations can operate simultaneously; which valley and elevated locations are unrepresented; which instrument methods can resolve the expected increment; and how will calibration, collocation, clocks and event logs be maintained? Proposed sites and equipment remain to be designed with the data custodians and relevant landholders. No deployment, purchase or external data request has been made.
The historical source audit now reconstructs the published 2014–2015 heat and equivalent flare dimensions together, with the embedded radiation-loss convention checked. It also identifies conflicting descriptions of hourly and daily emission treatment. A dated sustained-source screen is supportable; exact EA reproduction still requires the original hourly inputs, and the later 2015 event durations must not be mixed with 2014 masses. Source consistency and calculations
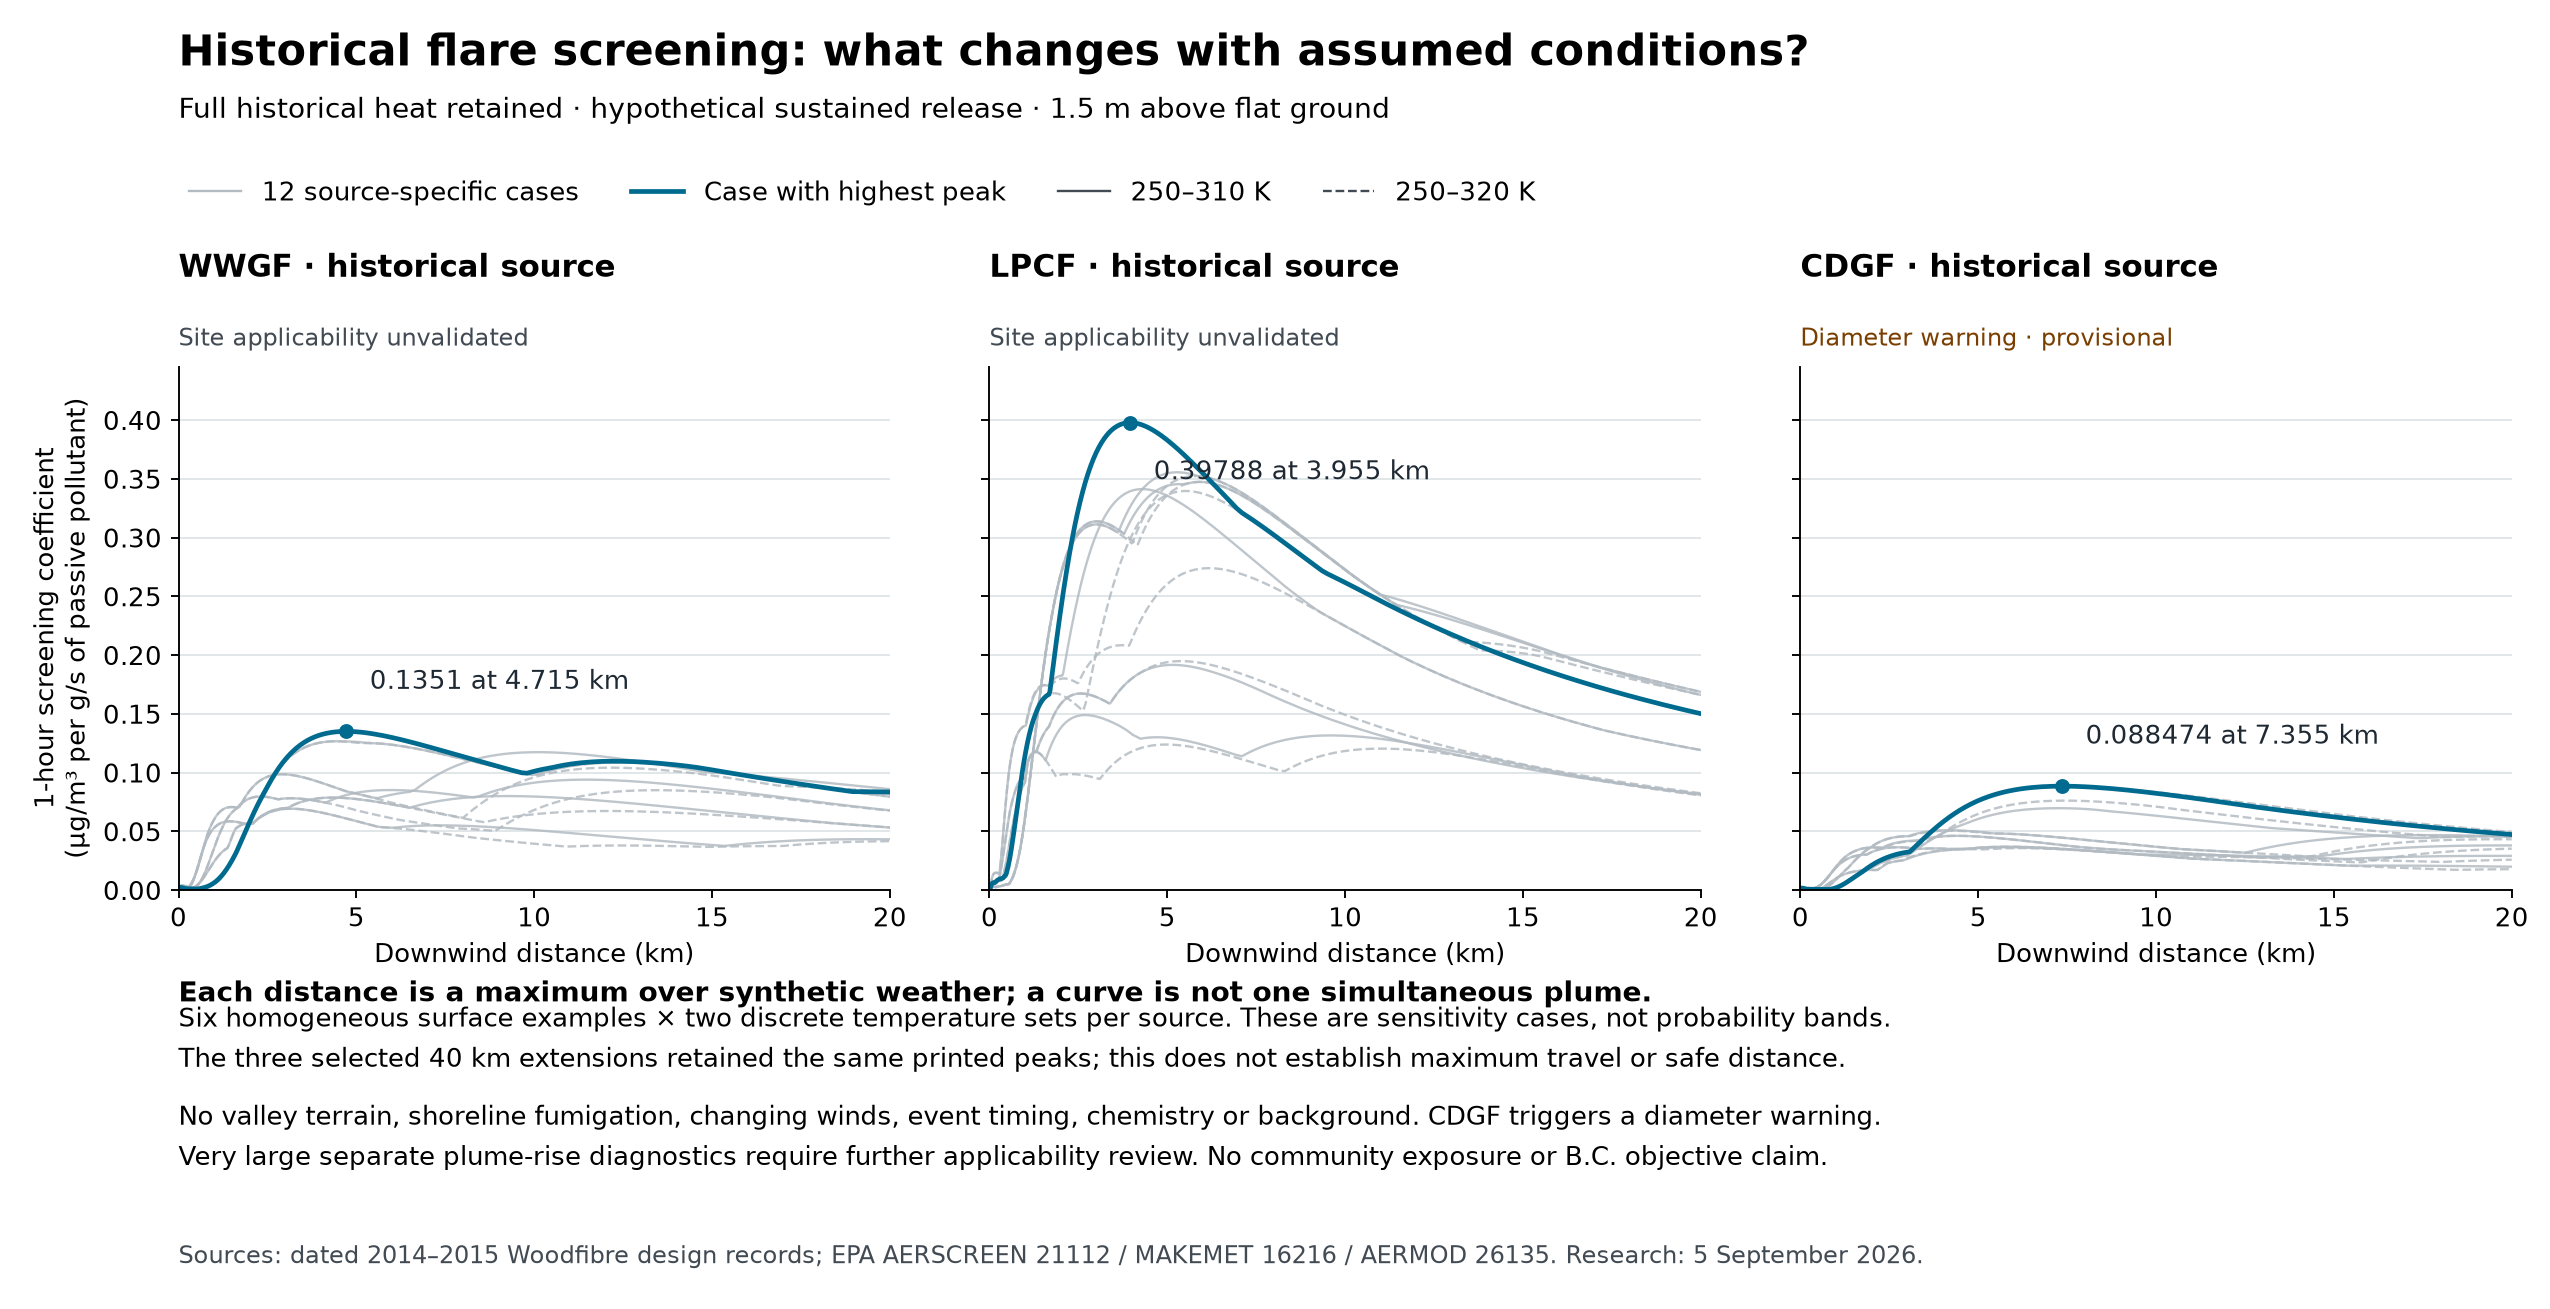
The first 36 historical screening sensitivities are now calculated, using all three historical heat sources, six assumed homogeneous surface examples and two discrete temperature sets. These are passive-pollutant increments at explicit 1.5 m receptors above a flat plane. Three selected 20-to-40 km search extensions retained their printed peaks, and a fixed-heat mass-rate doubling check passed. The largest source triggers an equivalent-diameter warning, and very large separate plume-rise diagnostics expose an additional applicability question. All cases remain unvalidated for Howe Sound; they supply no neighbourhood contours or objective-compliance finding. Inputs and assumptions, results and limitations, distance curves
A subsequent component diagnostic reproduced all three selected historical peaks and checked 906 receptor calculations. More than 99.99% of each selected ground peak comes from the model's penetrated-plume component. This is a numerical dependence in constructed cases, not an observed fraction of Woodfibre exposure. It makes validation of highly buoyant plume penetration and downward mixing especially important, alongside source heat, local vertical profiles and finite-event timing. The large separate report-height diagnostics are not trajectories. What the component check establishes and leaves unresolved
Use the current display as the community front end. Evaluate an established modelling chain appropriate to complex coastal flow; the leading candidate is representative numerical weather with CALMET/CALPUFF, alongside suitable simpler source checks. Final model choice must follow the question and observed performance. The July 2026 B.C. guideline is the starting point, including its recommendations on representative multi-year weather and completeness. B.C. dispersion guideline
The current browser solver has not demonstrated grid convergence. It will not be promoted to a prediction engine simply by increasing map smoothness or adjusting mixing until a plume looks plausible. A defensible result needs reproducible source inputs, demonstrated local wind skill, verified numerical setup, appropriate chemistry/background and independent evaluation. Before startup, weather validation can proceed while direct validation against Woodfibre flare events remains pending.
The first dated forecast-versus-observation case is complete, with raw files, exact UTC joins and explicit limitations. It provides a reproducible starting point rather than a validated wind reconstruction. The complete official EPA terrain, weather and dispersion reference chain has also been reproduced. Next, expand to independent episodes and evaluate a suitable treatment of local meteorology and terrain before attempting conditional source calculations. The established-model readiness record distinguishes software verification from site validation. Predictive community contours remain dependent on current source data, demonstrated local weather performance and appropriate background/chemistry.