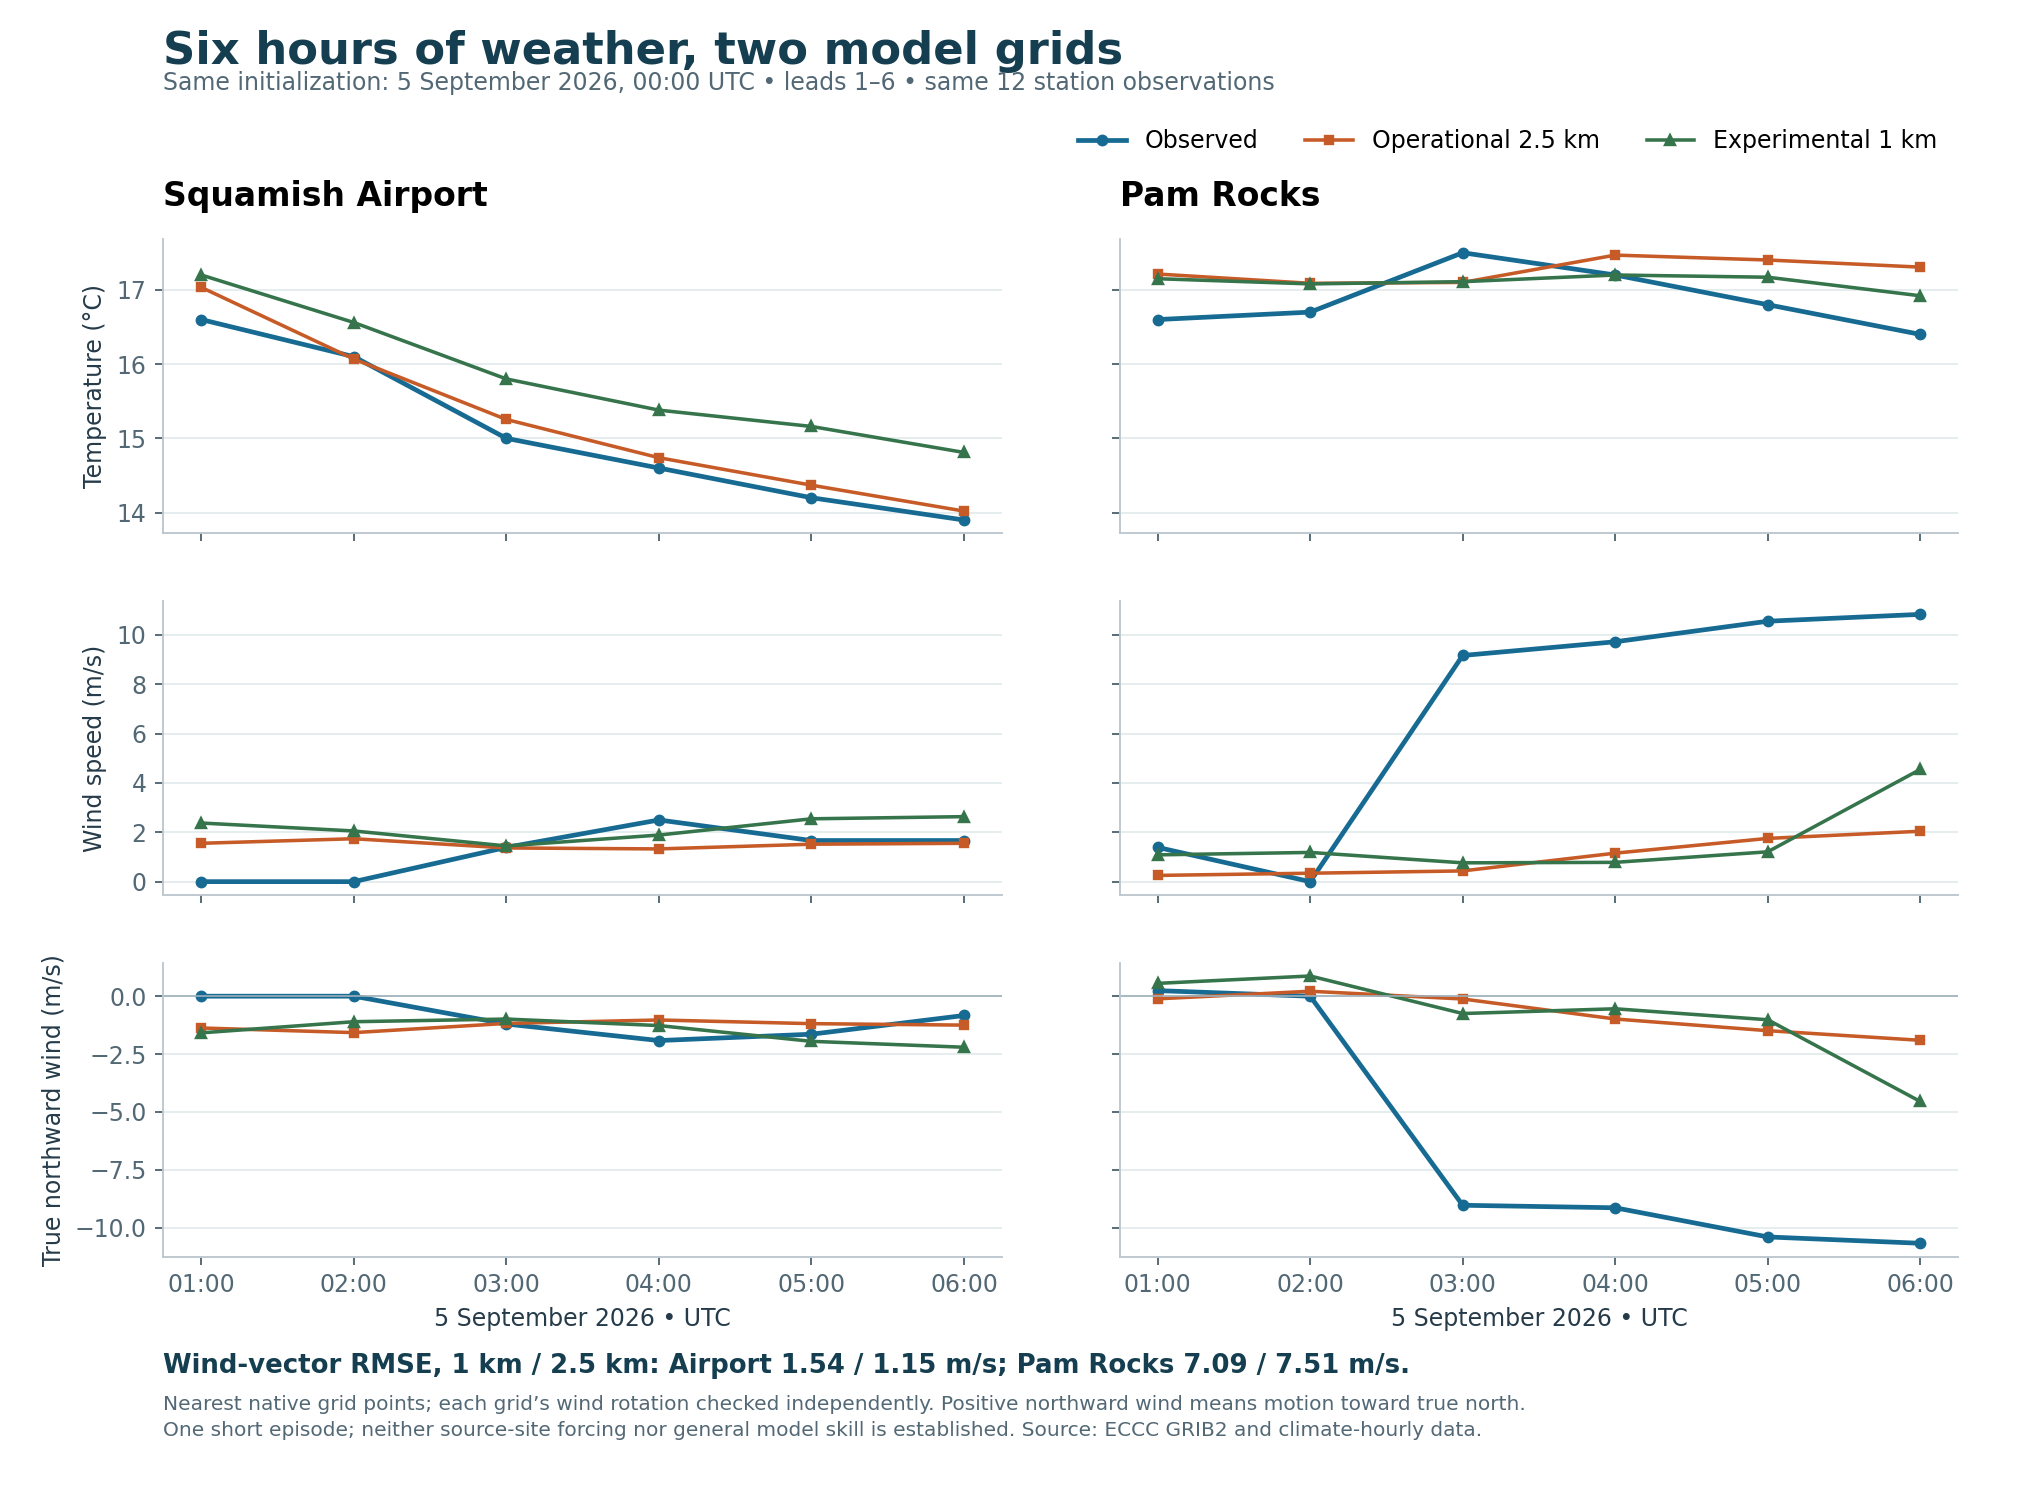
The experimental 1 km model improves the location and elevation of the nearest Woodfibre grid point, but its wind results are mixed. Over the same six observed hours it performs worse at Squamish Airport and slightly better at Pam Rocks, where both models substantially underestimate the strong wind. The finer grid does not yet provide acceptable source-site forcing or demonstrate general forecast skill.
Both forecasts were initialized 5 September 2026 at 00:00 UTC, and are compared at 01:00–06:00 UTC, forecast leads 1–6. Both use the same six observations at each station: 12 distinct observation records and 24 model–observation pairs. The hours were selected for complete common availability before examining errors. The previous 2 September comparison remains separate; results from different dates are not used to rank the models.
The actual West 1 km directory listed 5 September 00 UTC files; its 12 UTC first-hour directory was empty when checked. The corresponding 2 September first-hour U-wind URL returned HTTP 404, consistent with the documented short experimental archive. The operational model's actual dated 5 September directory was also inspected. All 68 acquired filenames were verified against those listings before downloading. Raw data total 112,406,800 bytes, below the 300 MB cap, with URLs and SHA-256 hashes retained. West 1 km documentation, operational HRDPS documentation, raw manifest
These are operational/experimental model outputs at their nominal initialization and valid times. Initialization time is not the time the files became available to a forecaster; publication occurs later. This diagnostic does not claim that every short-lead field was available before its valid hour. It is not a reanalysis, a newly run hindcast, a downscaled wind field or a dispersion validation.
Each location uses the nearest native grid point, without a land-only selection, interpolation or elevation correction. Station elevations are ECCC metadata, not verified sensor mounting heights. The Woodfibre coordinate remains the map proxy at 49.665253, −123.254185; it is neither a weather station nor an established flare location.
| Location | Reference elevation | Operational 2.5 km: distance / orography | Experimental 1 km: distance / orography |
|---|---|---|---|
| Squamish Airport | 53.7 m, station metadata | 792 m / 107.3 m | 412 m / 53.0 m |
| Pam Rocks | 7.1 m, station metadata | 815 m / 3.0 m | 391 m / 0.0 m |
| Woodfibre map proxy | About 9 m, legacy CDEM point check | 1,150 m / 568.4 m | 170 m / 135.0 m |
The finer-grid Woodfibre point is much nearer and less elevated, but is still about 126 m above the shoreline reference. A forecast of wind 10 m above its 135 m model terrain is not a measured wind 10 m above the shoreline. At the airport, closer terrain agreement also fails to guarantee a better forecast in this episode. The full nearest-point coordinates, rotation coefficients and four surrounding native orography points are retained in the provenance. Station metadata, legacy terrain evidence
Temperature, speed and vector scores use all six hours at each station. Bias means forecast minus observation. Vector root mean square error combines the errors in true east and true north motion. Direction uses only common hours when the observation and both forecasts have speeds of at least 1 m/s, so the two models receive exactly the same direction-score sample.
| Station / metric | Operational 2.5 km | Experimental 1 km |
|---|---|---|
| Airport temperature mean absolute error | 0.19 °C | 0.75 °C |
| Airport wind-speed mean absolute error | 0.79 m/s | 1.16 m/s |
| Airport wind-vector RMSE | 1.15 m/s | 1.54 m/s |
| Airport direction mean absolute error, 4 common hours | 13.4° | 20.4° |
| Pam Rocks temperature mean absolute error | 0.53 °C | 0.37 °C |
| Pam Rocks wind-speed mean absolute error | 6.06 m/s | 5.74 m/s |
| Pam Rocks wind-vector RMSE | 7.51 m/s | 7.09 m/s |
| Pam Rocks direction mean absolute error, only 2 common hours | 36.5° | 25.3° |
Bold identifies the smaller error in this limited sample, not a selected model for future predictions. West 1 km differs from the operational model in configuration as well as grid spacing; these differences cannot be attributed solely to spatial resolution.
At Pam Rocks, the observed winds at 03:00–06:00 UTC were 9.17–10.83 m/s from roughly north. Both forecasts substantially underestimate these four observations. At 06:00 UTC, the observation is 10.83 m/s, West 1 km gives 4.55 m/s, and operational 2.5 km gives 2.04 m/s. The chart's negative northward component means motion toward the south: a northerly wind is a wind from the north. These are statements about Pam Rocks, not an automatic source-site or whole-fjord flow classification.
The comparison CSV supplies all 24 pairs and errors; the original observation CSV retains all original fields for the 12 selected records. Null temperature/wind flags and complete values were checked, but these recent observations can still be revised. Exact station-specific wind averaging configuration and exposure have not been independently established. The forecast fields have GRIB stepType=instant; neither these nor the near-hour wind observations are called full-hour means.
The API query's literal date range is not reported as UTC coverage: returned UTC_DATE values were parsed, checked against LOCAL_DATE + 8 hours, and joined to decoded GRIB validity times. Buffered records outside 01:00–06:00 UTC were excluded. All clock-time conventions and the exact queries are in the provenance.
The models use different rotated grids:
| Metadata | Operational 2.5 km | Experimental West 1 km |
|---|---|---|
| Native dimensions | 2540 × 1290 | 1330 × 1180 |
| Grid increment | 0.0225° | 0.009° |
| Southern pole latitude | −36.088520° | −33.443381° |
| Southern pole longitude | 245.305142° | 266.463574° |
| U/V relative to grid | Yes | Yes |
Each model's U/V was rotated with its own pole and native point coordinates, then checked against independently supplied true-direction and wind-speed fields at leads 1, 3 and 6. Among checks with derived and published speeds at least 1 m/s, the largest direction difference is 0.56°. Across all 18 checks, the largest is 2.73°, occurring at only 0.25 m/s. This weak-wind discrepancy is retained explicitly rather than hidden. The maximum speed-check difference is about 0.021 m/s. Rotation basis normalization and initialization/valid-time/units checks also passed.
Two pressure levels, 985 and 950 hPa, were acquired at 06:00 UTC, together with model surface pressure. At the Woodfibre proxy's operational-grid point, 985 hPa is below the model surface and is excluded; 950 hPa is only about 4.7 m above model orography and passes the numerical mask. Both levels are above the West 1 km model surface. These are this episode's masks, distinct from the previous 2 September masks.
Passing the mask does not establish a physically adequate source profile. Pressure-level heights are geopotential metres and surface orography is metres; their difference is only approximate height above model terrain. Only two pressure levels at one time were sampled, no local upper-air observation was acquired, and no inversion depth is inferred. Profile values and masks
The 1 km product warrants further testing because its source-area terrain representation is closer and it reduced some Pam Rocks errors in this case. It should not replace source-site weather or become accepted plume forcing on this evidence. The next useful work remains onsite observations, local vertical structure, and independent matched episodes covering multiple seasons and wind regimes, with careful terrain-aware processing. The archive retention limit also makes preserving exact raw inputs important.
This work leaves the frozen 2 September files and package unchanged. New values, provenance, chart and manifests are separate; the living catalogue records the expanded acquisition status.