5 September 2026 · Historical ambient observations · Station E304570 / NAPS 101603
Three years of verified station observations now replace the earlier three-day sample as the research project’s ambient reference dataset. The recovered record contains 157,824 hourly entries for PM₂.₅, NO, NO₂, NOx, ozone and SO₂. Of these, 149,871 contain numeric readings and 7,953 contain the provider’s missing-value marker.
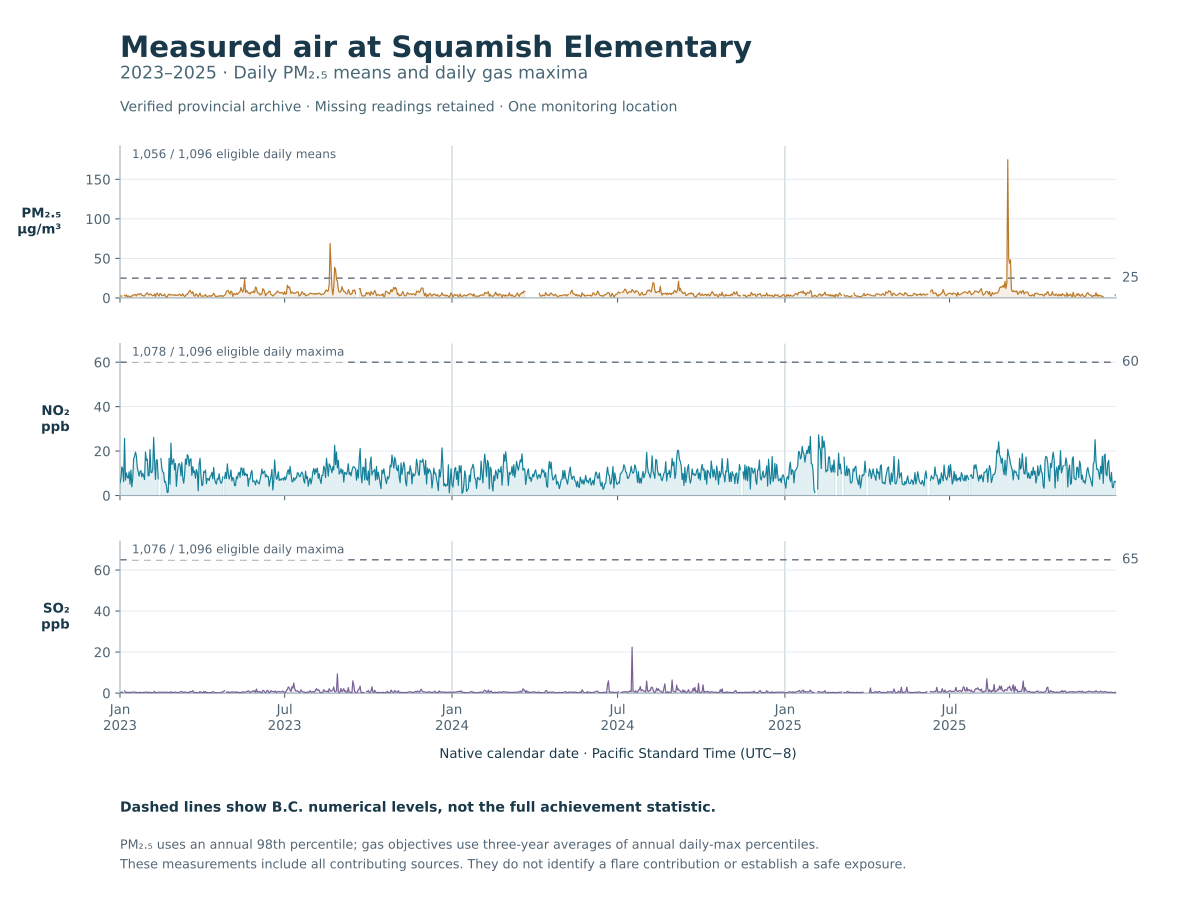
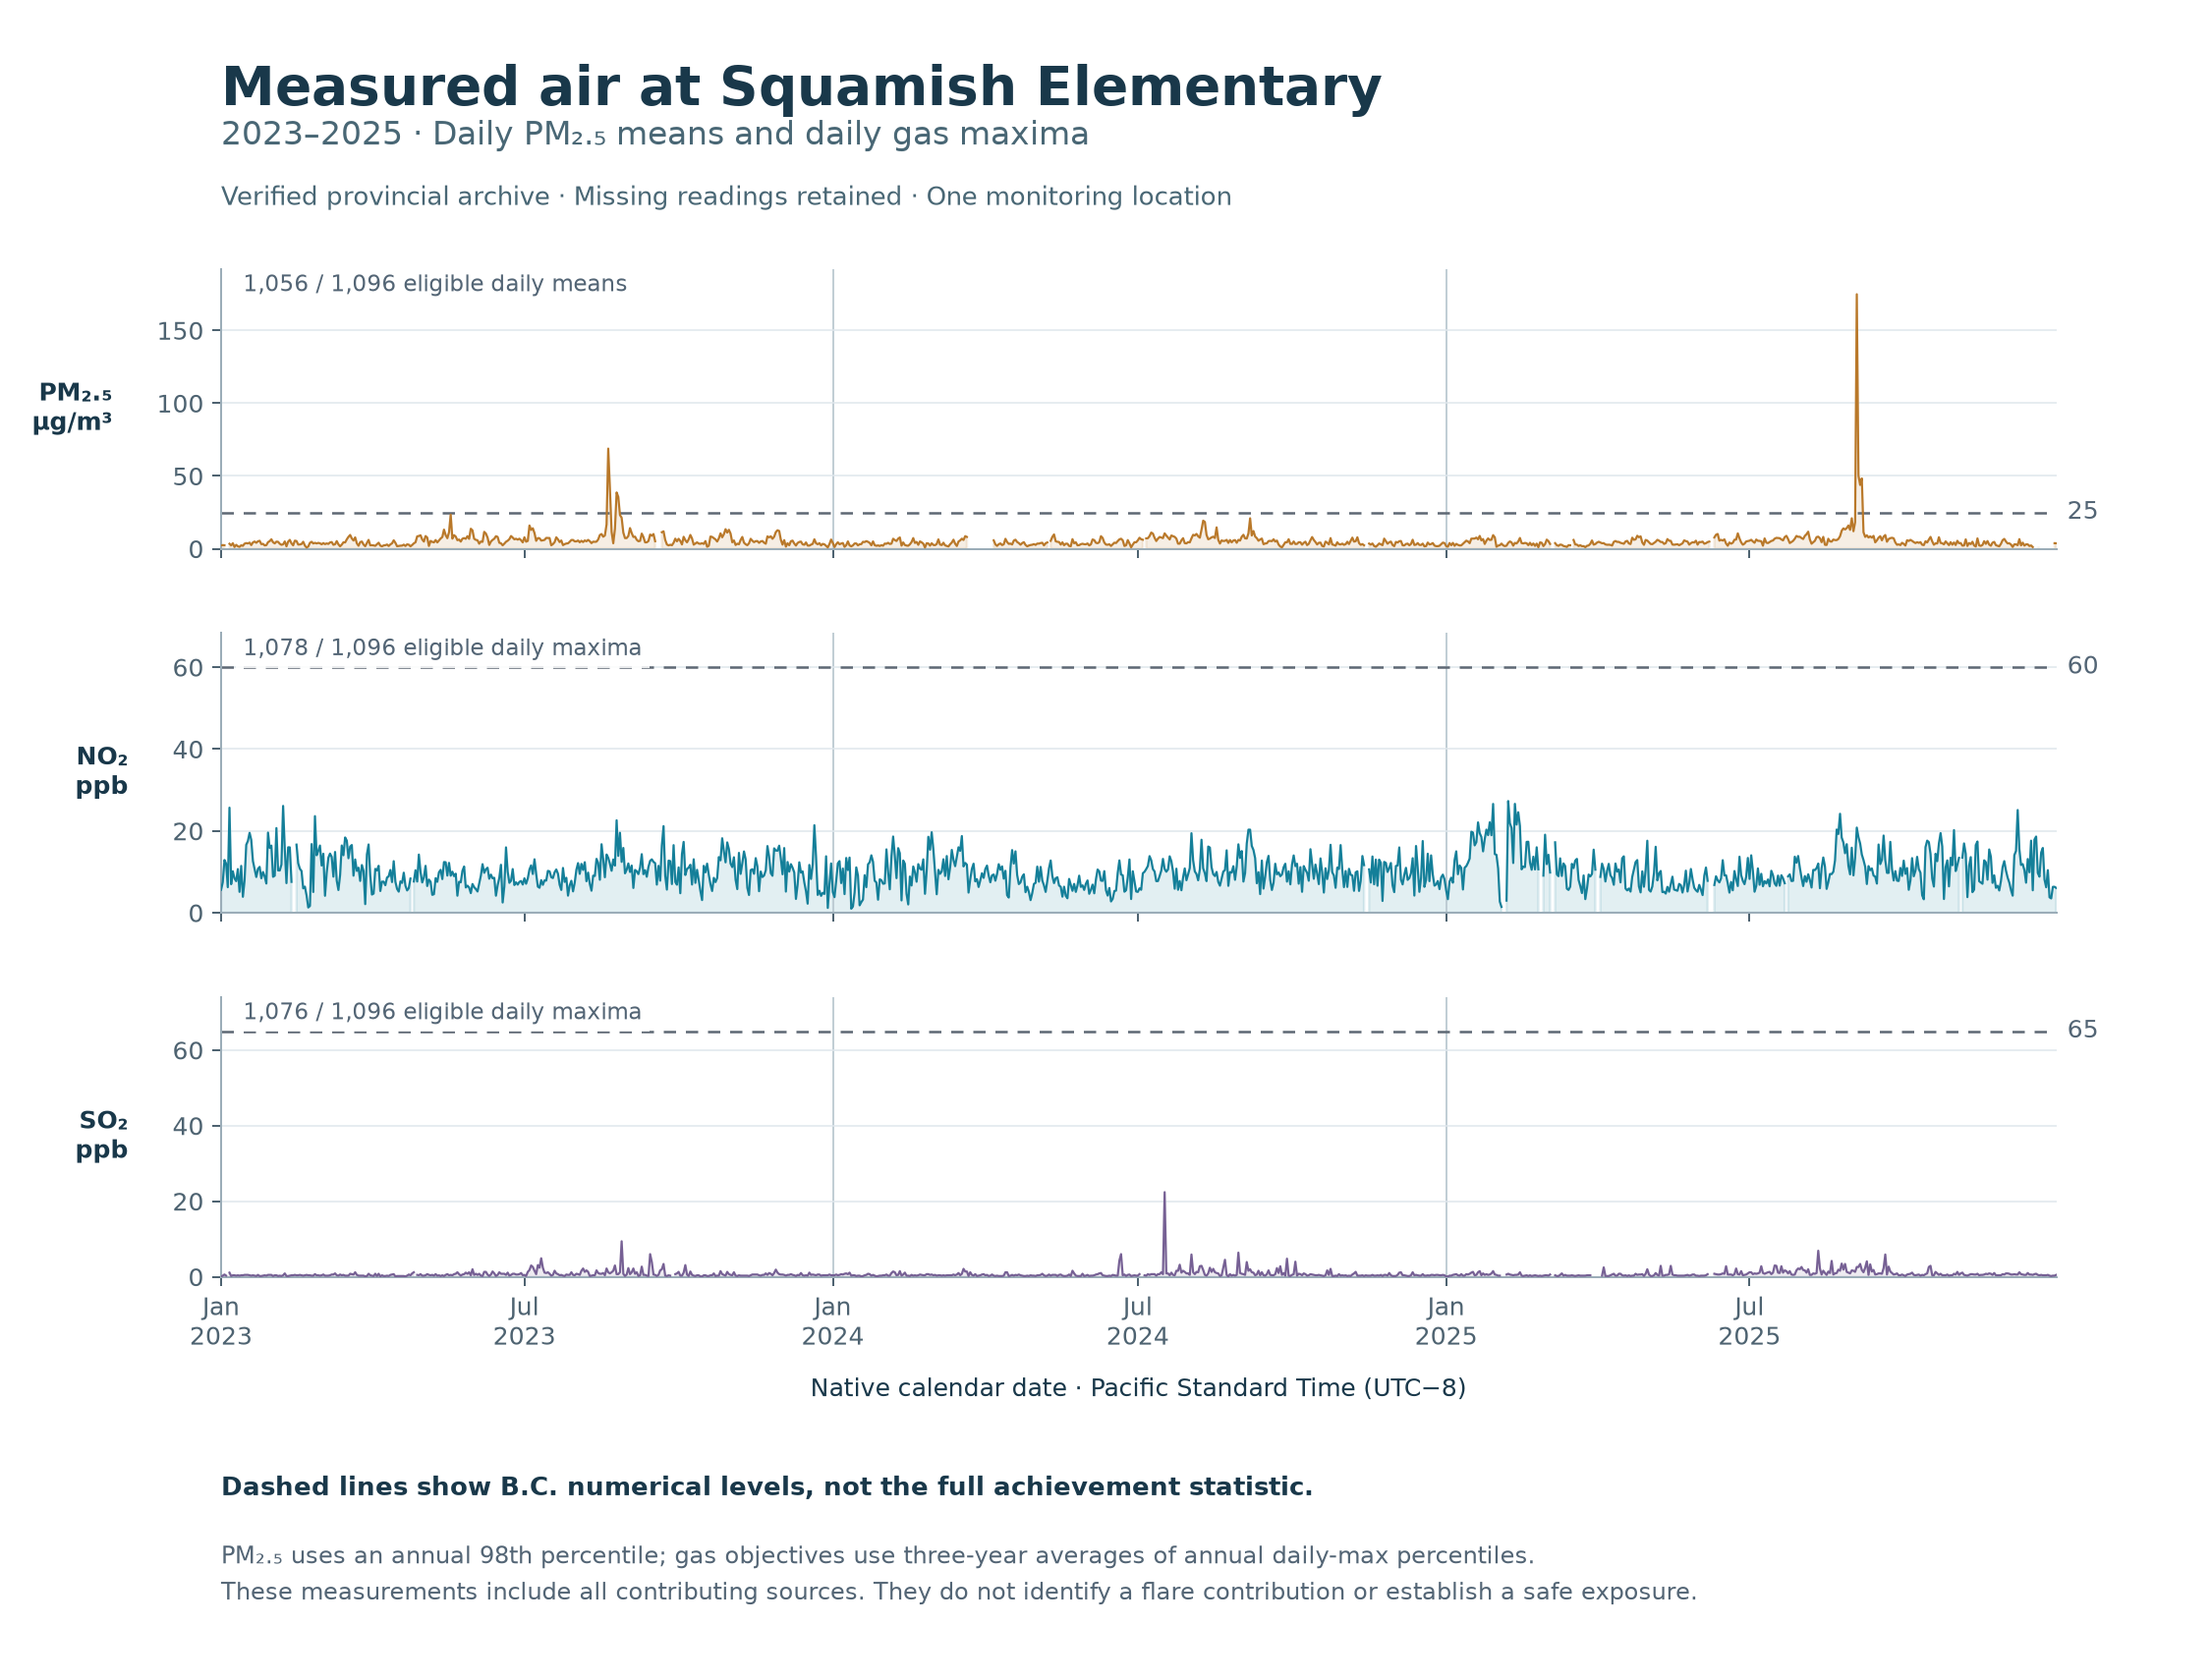
The calculated PM₂.₅, NO₂ and SO₂ station metrics below are below the current B.C. objectives. The time series also contains substantial short PM₂.₅ episodes. These are observations at one monitor, not an estimate of Woodfibre’s contribution or an official determination of compliance across Squamish.
The plot uses full-precision PM₂.₅ daily means and eligible gas daily maxima; SO₂ hours follow the prescribed 0.1 ppb rounding. Dashed lines show numerical levels. The full objective statistics use annual percentiles and, for gases, a three-year calculation. Gaps remain where a day lacks enough readings. Vector figure.
These reported values use the pollutant-specific methods described below. The 2023 and 2024 annual comparisons are retrospective comparisons with current objectives. The gas hourly metrics use the complete 2023–2025 window ending in 2025. Numerical objectives are from the current B.C. factsheet, Tables 1–2; national standards are a separate comparison and are not substituted here.
| Station statistic | 2023 | 2024 | 2025 | Current B.C. objective |
|---|---|---|---|---|
| PM₂.₅ · annual 98th percentile of daily means (µg/m³) | 17 | 11 | 16 | 25 |
| PM₂.₅ · annual mean (µg/m³) | 6.0 | 4.7 | 5.7 | 8 |
| NO₂ · annual mean (ppb) | 4.7 | 4.4 | 5.2 | 17 |
| SO₂ · annual mean (ppb) | 0.2 | 0.3 | 0.3 | 4 |
| Three-year station statistic, 2023–2025 | Reported value | Current B.C. objective |
|---|---|---|
| NO₂ · mean of annual 98th percentiles of daily maximum hourly values | 20 ppb | 60 ppb |
| SO₂ · mean of annual 99th percentiles of daily maximum hourly values | 5 ppb | 65 ppb |
The unrounded three-year results are approximately 19.8474 ppb for NO₂ and 4.6333 ppb for SO₂; final whole-ppb values follow the disclosed rounding rules. All three annual percentiles are included for each gas. All nine pollutant-year cases met the ordinary completeness requirements for their daily-percentile and annual-mean calculations; no high-concentration completeness exception was used.
An annual percentile is not a ceiling on individual days. For example, 3 September 2025 had a PM₂.₅ daily mean of 174.8 µg/m³, based on 23 valid hourly readings (175 µg/m³ at the provincial whole-number reporting precision). It remains in the analysis. The source of that episode has not been established by this work, and no wildfire or other high-concentration periods were removed. Its presence is compatible with the much lower annual 98th-percentile value.
| Pollutant | Numeric / scheduled hours, 2023 | 2024 | 2025 |
|---|---|---|---|
| PM₂.₅ | 8,661 / 8,760 | 8,384 / 8,784 | 8,462 / 8,760 |
| NO | 8,357 / 8,760 | 8,374 / 8,784 | 8,204 / 8,760 |
| NO₂ | 8,357 / 8,760 | 8,374 / 8,784 | 8,204 / 8,760 |
| NOx | 8,357 / 8,760 | 8,374 / 8,784 | 8,204 / 8,760 |
| Ozone | 8,299 / 8,760 | 8,313 / 8,784 | 8,120 / 8,760 |
| SO₂ | 8,355 / 8,760 | 8,366 / 8,784 | 8,106 / 8,760 |
The source is the B.C. verified annual air archive. Every scheduled timestamp is present, including all 8,784 hours of leap year 2024. A timestamp with NA remains a missing reading; it is not converted to zero. There are no duplicate hour/parameter records or negative numeric values in this recovered subset.
Native dates use fixed Pacific Standard Time, UTC−8, including summer. The provider’s hour ending 24 belongs to its labelled day but appears as next-day midnight in its normalized timestamp. All 157,824 date/time pairs passed an independent calendar check. All 432 records from the earlier May 2025 sample matched exactly.
The station files identify one instrument per pollutant throughout these records: PM25_SHARP5030i; NOX_TEI42i for NO/NO₂/NOx; O3_APIT400; and SO2_APIT100U. The current metadata identifies E304570 at 49.70516, −123.15133, elevation 6 m. Metadata files stored under the annual directories were modified in August 2026; they are not historical instrument-status snapshots. The records’ instrument labels do not replace calibration or siting documentation.
The annual archive is provider-verified and supplies no separate row-level QA flag. RAW_VALUE is its full-precision column, not the provisional live feed. Both that column and the provider’s rounded values are preserved. Reconstructed half-up rounding to 0.1 agrees with all 149,871 supplied numeric rounded values.
To avoid downloading unrelated provincial records, the source archive retains exact headers and contiguous original byte windows containing each complete station-year block and neighbouring station boundaries. The 18 windows total 56.6 MB before compression. Source sizes and modification times were checked before and after retrieval. Hashes identify the downloaded bytes, not an unacquired full provincial file. Exact source URLs, offsets, station metadata and checks accompany the download.
PM₂.₅: valid daily means need at least 18 hourly readings; each quarter needs at least 75% valid days. The provincial implementation guide specifies an annual value based on four equally weighted quarterly means. We use quarterly means of valid daily means and retain full precision until reporting. This is the declared interpretation of that detailed guidance; the current webpage gives a less specific daily-average description. The 2025 pooled-daily alternative is 5.8 µg/m³, compared with the primary quarter-weighted 5.7 µg/m³. The daily percentile is a ranked observation, not an interpolated quantile. Provincial PM₂.₅ implementation guide, Appendix IV.
NO₂: the primary provincial calculation retains full-precision hourly values and selected annual percentiles through the three-year average. Annual means average valid hourly readings. Daily maxima ordinarily need 18 hours; annual daily/hourly completeness rules use 75% overall and 60% in each quarter. The final whole-ppb half-up convention is taken from CCME where the provincial appendix is less explicit. A separately calculated hourly-pre-rounding sensitivity leaves the reported three-year result at 20 ppb. Provincial NO₂ guide, Appendix I, CCME NO₂ calculation guidance.
SO₂: current provincial reporting follows the CCME method, including 0.1 ppb hourly values, the daily-maximum 99th percentile and whole-ppb three-year result. Annual means report to 0.1 ppb. Coverage and exception flags are retained separately. A full-precision-hourly sensitivity leaves the reported three-year result at 5 ppb. CCME SO₂ calculation guidance, B.C. SO₂ reporting methods.
The technical methods note gives the exact ranks, rounding, completeness rules, provincial/national differences and remaining interpretation questions. Machine-readable results contain every daily mask, quarterly numerator and denominator, selected rank and tied date, unrounded value, reported value and sensitivity.
A second AI-assisted implementation read the native station files independently and reproduced 23,538 primary checks and 15,672 sensitivity checks without discrepancies. This verifies arithmetic and membership for the acquired record. High-value exception branches were not exercised by these observations, and this is not qualified external scientific review.
This dataset provides measured town-air context and the ozone/NO/NO₂ records needed for further chemistry work. It does not establish a single background concentration for every location or weather condition in the 20 × 20 km map.
B.C.’s dispersion guidance treats background selection separately from objective achievement, requires attention to monitoring-site representativeness, and matches baseline and model averaging periods. Its annual model-baseline recommendation uses hourly values, which differs from the provincial PM₂.₅ achievement calculation above. The most recent complete year is now available for that assessment; suitability and any event exclusions still need evidence. B.C. dispersion guideline, §8.1, pp. 70–72.
The next useful steps are to evaluate weather and source influence around the monitor, recover simultaneous onsite and vertical weather, and align any future flare-event records with these hourly intervals. Current flare heat/emission histories and local wind validation remain necessary for predictive community concentrations. The explorer’s plume calculations have not been changed by this analysis.
Native units, missing values and source status are retained. No records request or contact with a data custodian was sent. The research plan keeps the remaining data priorities separate from the public open-house questions.