11 September 2026 · Diagnostic stage comparison
The terrain-deflection step introduces most of the previously selected large downward-motion discrepancy, and smoothing partly offsets it. This result identifies a calculation stage to investigate. It does not establish whether the resulting motion is physically realistic, select a preferred wind configuration, or change the public plume.
All three diagnostic replays reproduce their original CALMET output files byte for byte. The captured stages cover the same 24 intervals of 1 June 2023, 201 × 201 cells at 200 m spacing, ten layers and unchanged weather and terrain. Results retain the original 101 × 101-cell study area and all 13 reference points. No community receives a separate tuning criterion. These reference points are not a complete exposure receptor network.
The active path starts from interpolated regional horizontal winds, applies the Froude-number terrain-deflection routine where enabled, adds slope flow, copies the resulting field in the absence of local wind observations, and smooths it. The model then integrates horizontal divergence upward from zero terrain-coordinate vertical velocity at the ground. Native regional vertical velocity is not adopted along this path. The kinematic and O’Brien/top correction options are disabled in these retained cases. Released CALMET source.
At the intermediate stages, we reconstruct the vertical velocity that their horizontal divergence would imply. Those are diagnostic calculations, not separately simulated or observed updrafts or downdrafts. The signed contributions telescope to the final saved terrain-coordinate W. A physical-vertical estimate additionally needs the previously documented terrain-advection term.
This column, time and height were fixed before the experiment: UTM zone 10N E490100/N5505900 m, interval starting 20:00 fixed PST (UTC−8), at the 1,500 m face above model terrain. The same location was used in the earlier vertical-resolution check. Positive values below point upward; negative values point downward in the model coordinate.
| Configuration | Incoming implied W | Terrain-deflection increment | Slope-flow increment | Smoothing increment | Final implied W |
|---|---|---|---|---|---|
| Adjustments off | -0.216410 | +0.000000 | +0.000000 | +0.234271 | +0.017861 |
| Terrain search, 5 km | -0.216410 | -25.369275 | -0.986384 | +15.650428 | -10.921641 |
| Terrain search, 10 km | -0.216410 | -25.369275 | -1.336174 | +15.754960 | -11.166899 |
All values are m/s. The no-observation transfer contributes exactly zero. For example, in the 10 km case, the incoming −0.216 m/s changes by −25.369 m/s at terrain deflection and −1.336 m/s with slope flow; smoothing adds +15.755 m/s, leaving about −11.167 m/s. The large intermediate implied value is not a recorded atmospheric wind.
The corresponding final physical-vertical estimates from the retained calculation are approximately +0.187, −10.832 and −11.077 m/s for off, 5 km and 10 km respectively. The native vertical comparison gives approximately −0.0033 m/s at this supported target. That native value is itself model output near its printing precision; it is not an observation.
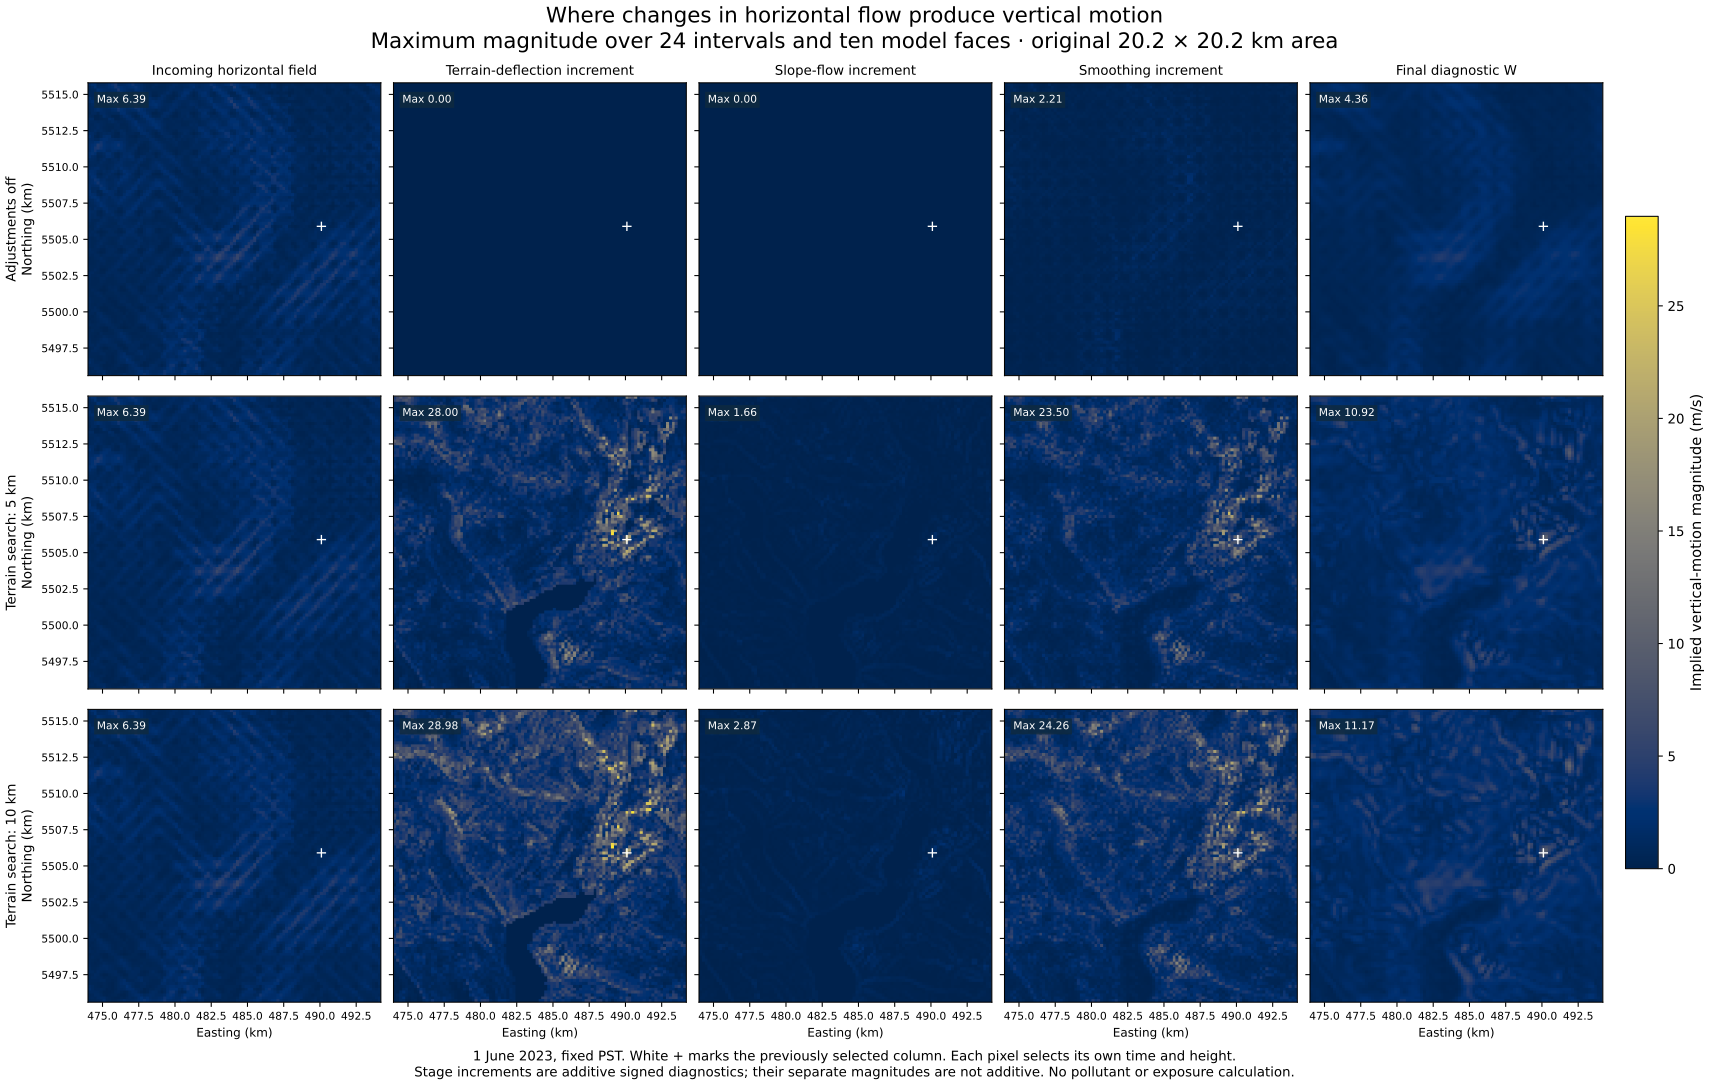
The table uses all original study cells, all 24 intervals and all ten faces. It describes magnitudes of stage contributions. Their absolute averages or separate maxima cannot be added, because positive and negative contributions cancel and maxima can occur at different positions, heights or times.
| Configuration | Stage or increment | Mean absolute magnitude (m/s) | Maximum absolute magnitude (m/s) |
|---|---|---|---|
| Adjustments off | Incoming field | 0.225348 | 6.385762 |
| Adjustments off | Terrain-deflection increment | 0.000000 | 0.000000 |
| Adjustments off | Slope-flow increment | 0.000000 | 0.000000 |
| Adjustments off | Smoothing increment | 0.078116 | 2.209153 |
| Adjustments off | Final implied W | 0.197117 | 4.364421 |
| Terrain search, 5 km | Incoming field | 0.225348 | 6.385762 |
| Terrain search, 5 km | Terrain-deflection increment | 0.271483 | 27.996878 |
| Terrain search, 5 km | Slope-flow increment | 0.096167 | 1.659483 |
| Terrain search, 5 km | Smoothing increment | 0.274605 | 23.503260 |
| Terrain search, 5 km | Final implied W | 0.296936 | 10.921641 |
| Terrain search, 10 km | Incoming field | 0.225348 | 6.385762 |
| Terrain search, 10 km | Terrain-deflection increment | 0.426610 | 28.975603 |
| Terrain search, 10 km | Slope-flow increment | 0.123195 | 2.874202 |
| Terrain search, 10 km | Smoothing increment | 0.386408 | 24.257025 |
| Terrain search, 10 km | Final implied W | 0.354967 | 11.166899 |
Terrain deflection produces large local increments in both terrain cases, with substantial subsequent cancellation. The incoming fields are identical across the three cases. The unadjusted case still has nonzero divergence and vertical motion, so identifying this terrain contribution does not validate the off case. Full per-height, per-interval and reference results retain the broader distributions.
The panels show maximum magnitude at each cell over all 24 intervals and ten faces. Each pixel can select a different time and height. These are model diagnostics, not a simultaneous flow map, pollutant plume or health-risk zone. Vector figure.
The new capture records the actual boundary values consumed by the divergence calculation. These are the pre-smoothing normal wind components; they are not zero-wind walls. Later code overwrites them, which is why the old final output alone could not reproduce the perimeter calculation faithfully. The 800 unique perimeter cells are checked separately, without inventing uncaptured boundary states.
The original 87,266,160 saved wind values are unchanged across the three replays. A reconstruction following the source's float32 operation order reproduces all captured final divergence and W values exactly. The largest independent float64 discrepancy is 1.6e-06 m/s, below the pre-existing 0.00005 m/s arithmetic tolerance. The disabled slope additions, no-observation copies and final-versus-saved winds also match exactly. These are software and arithmetic checks, not meteorological validation.
The independent implementation agrees with the full scalar/profile comparisons within 7.11 × 10⁻¹⁵ m/s. Three reported maximum-height differences are exact equal-value plateaus, established using rational arithmetic on the captured binary32 winds. The two sets of 54 compact maps differ in 1,926 of 1,344,654 entries by one binary32 rounding step; every differing entry lies at an exact rational midpoint. Independently reproducing each calculation order reproduces its maps bit for bit. The original maps and maximum coordinates are retained, with these qualifications in the comparison checks and rounding audit.
An independent reconstruction now covers all 2,400 terrain-case, interval, layer and stencil-point branch decisions. All decisions match the captured changes; wind-component differences remain below 1.2 × 10⁻⁷ m/s. At the selected hour, all four neighbouring cells qualify for terrain deflection through the lower eight layers. Their differing local terrain gradients redirect winds onto different full-speed tangents, separating the flow across the column. The centre cell’s own horizontal velocity does not enter this central-difference divergence calculation.
The east–west change contributes −14.275813 m/s and the north–south change −11.093462 m/s to the implied W increment, totalling −25.369275 m/s. The selected neighbours are well within the activation conditions, so this example is not explained by a near-critical Froude switch. These are ordered calculation-stage contributions; changing one stage would also change the inputs to later stages. Branch reconstruction checks, all branch decisions, and directional budgets.
The remaining question is whether the terrain-deflection rule and its inputs represent local flow. Each column’s single lapse-rate parameter and surface temperature are reused at all heights for this obstacle test. The lapse-rate calculation draws on the lower atmosphere, around the lowest layer and 200 m, unless a convective override applies. This identifies an assumption to evaluate against height-varying temperature and wind profiles; it does not establish a thermal error. Obstacle heights, terrain tangents and full-speed redirection also need physical justification.
A next controlled check should compare the retained vertical profiles with that shared stability treatment, then evaluate any proposed change across the entire declared area and independent weather episodes. Another increase in layer count or more smoothing alone would not establish accuracy. Suitable local vertical wind and temperature profiles remain needed to evaluate real flow; present surface-wind mismatches and unknown assimilation history also remain.
No new emission case, weather forcing, current-source inference or pollutant result follows from this diagnostic. The public Explorer and saved-wind viewer remain as previously published.
Summary and extrema, fixed-column contributions, all reference profiles, per-height results, per-interval results, root checks, independent checks, frozen protocol, and capture schema.