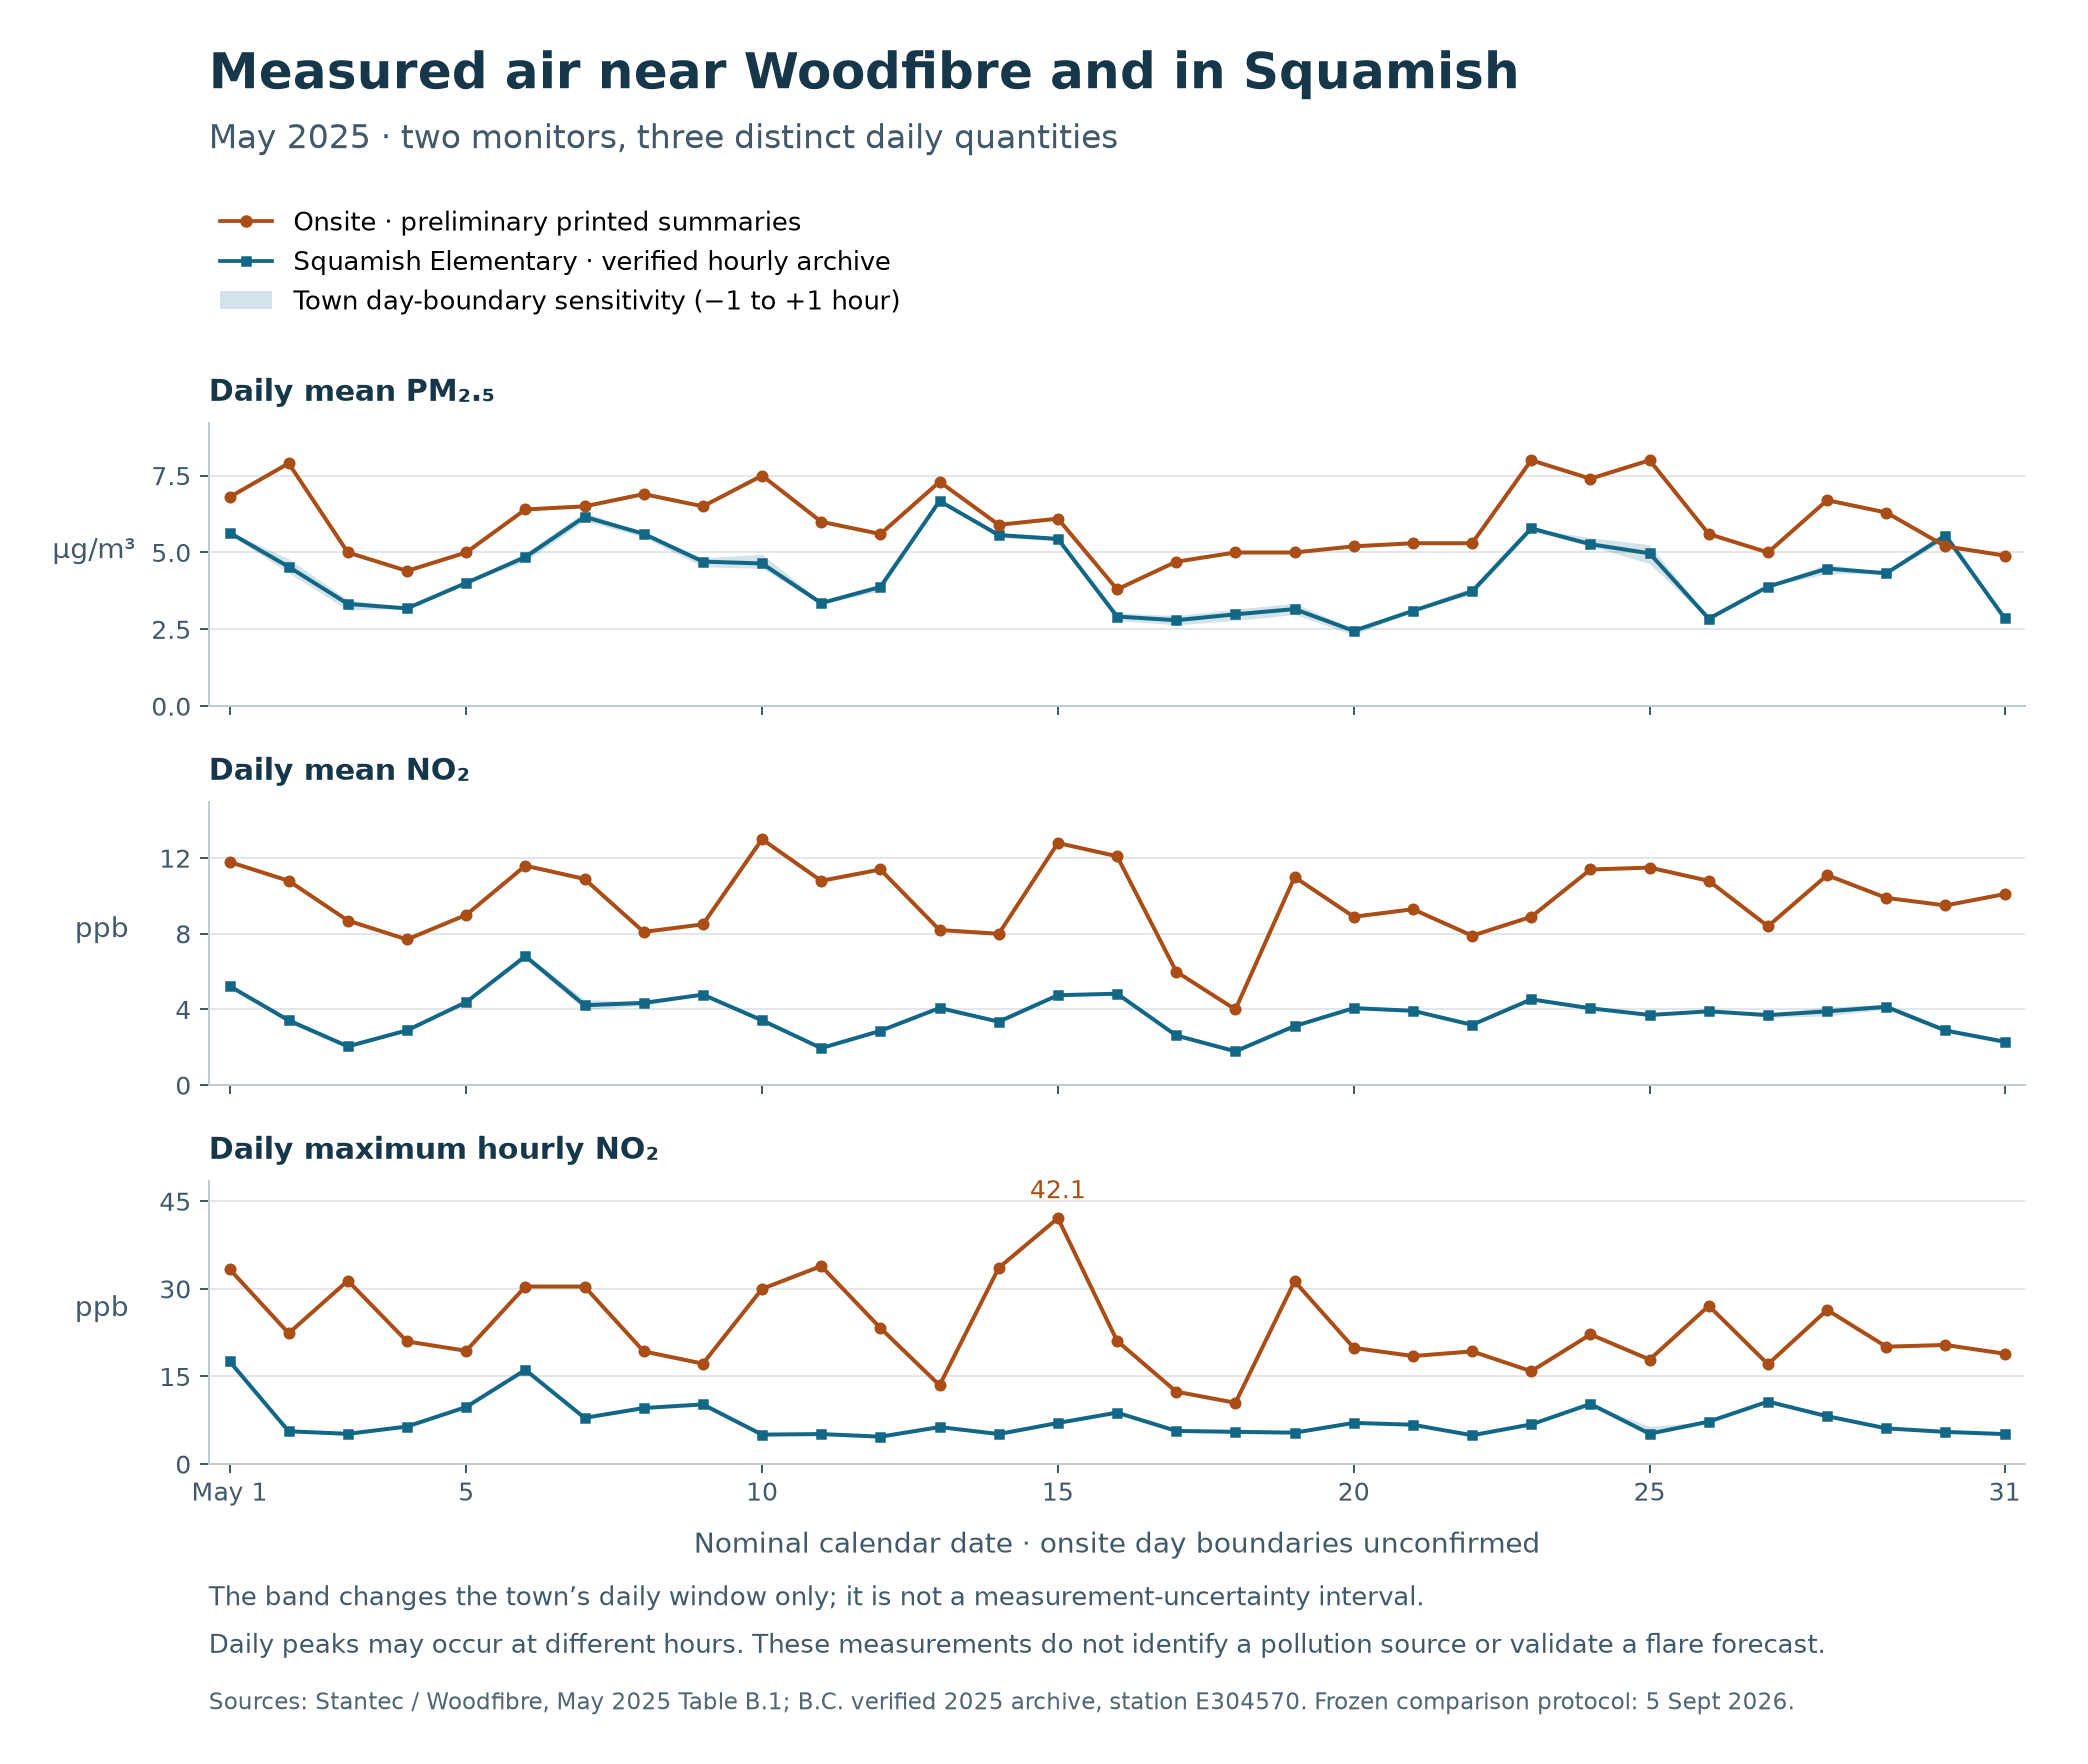
Published daily measurements near the Woodfibre floatel were generally higher than the corresponding town-monitor summaries during May 2025. This gives us a reason to examine local background differences before applying the town record across the simulation area. It does not identify a pollution source or establish a town-to-site correction.
The onsite series comes from Stantec’s report for Woodfibre, Table B.1, issued 7 July 2025. The town series is reconstructed from B.C.’s provider-verified hourly archive for Squamish Elementary. Each row below averages the corresponding daily values over the same 31 nominal dates. The daily-maximum row averages 31 separate hourly maxima; it is not an hourly or daily mean concentration. Original onsite report, Table B.1, town-data study.
| Quantity | Onsite | Squamish Elementary | Average onsite-minus-town difference |
|---|---|---|---|
| Daily mean PM₂.₅, µg/m³ | 6.0 | 4.3 | +1.7 |
| Daily mean NO₂, ppb | 9.7 | 3.7 | +6.0 |
| Daily maximum hourly NO₂, ppb | 23.2 | 7.5 | +15.8 |
Reported onsite PM₂.₅ was higher on 30 of 31 nominal dates. Both onsite NO₂ quantities were higher on all 31. The largest difference between daily hourly NO₂ maxima was on 15 May: onsite 42.1 ppb versus town 7.0 ppb. Those peaks may have occurred at different hours.
The town record provides a useful measured reference, but these results do not establish that it represents onsite conditions. The monitors use different particle instruments: onsite BAM 1020 and town SHARP5030i. The onsite report labels its observations Level 0 validation and describes earlier adjustments of small negative PM₂.₅ and NO₂ readings. It does not provide daily valid-hour counts or an explicit daily clock convention. These distinctions prevent interpreting the measured difference as a project contribution. Onsite methods and processing, town-station context.
For the town series, each PM₂.₅ day had 24 valid hours; NO₂ days had 22–23. All passed the comparison’s 18-hour minimum. The primary window uses fixed PST. Moving that window one hour earlier or later left the average differences close to +1.7 µg/m³ for PM₂.₅, +6.0 ppb for daily NO₂, and +15.7–15.8 ppb for daily hourly NO₂ maxima. Individual town values changed by up to 0.34 µg/m³, 0.30 ppb and 1.26 ppb respectively. This tests the town-window choice; it cannot recover the unknown onsite hourly timing.
An independent calculation reproduced all paired values, counts, time windows and summaries: 84,941 field checks, no discrepancies. The three onsite columns also matched the report’s overlapping weekly tables in all 93 cells. This verifies the extraction and arithmetic, rather than the instruments or their spatial representativeness.
The 2025 daily-record collection now covers all twelve monthly reports, allowing a broader seasonal comparison. Their printed summaries remain distinct from final hourly observations. The next priorities are final onsite hourly values and quality flags; clock and daily-aggregation rules; dated inlet, calibration and instrument records; and simultaneous weather and source-activity logs. Operator filings.
These daily measurements have not been used to recalibrate the plume map. The comparison protocol, daily pairs and full results retain the calculation details.